TMAD Weekly: Market Records vs. Reality Check
$MXL $RXT $AIP

Hi everyone,
Thanks to everyone who joined our webinar today at 1pm ET. Here is the recording.
We have another one tomorrow at 1pm ET for paid and free members. Link is here.
Now, let’s look at the market.
Last week, we watched the S&P 500 print a record close of 7,501 and the Nasdaq hit 26,635. On the surface, it looks like a relentless bull run. We saw some cracks beneath the surface due to scorching inflation data and a tightening geopolitical knot.
As we look toward the first FOMC meeting under Warsh in June, the “soft landing” narrative is being stress-tested by a potent cocktail of liquidity injections and rising energy costs. But Warsh is about to change how we measure PCE, which, even in high inflation, could mean rate cuts.
The $9.86 Billion Band-Aid
Behind the scenes, the financial “plumbing” is struggling. The Fed is set to pump $9.86 billion into the system next week to keep things moving. This is a strange move considering wholesale inflation (PPI) just hit 6%—triple what experts expected. The Fed is essentially trying to stabilize the system while price pressures are still accelerating.
The Inflation Metric Game
Incoming Fed Chair Kevin Warsh has signaled he wants to change how we measure price increases. Since 2000, the Fed has used Core PCE (which ignores food and energy). Warsh favors Trimmed Mean PCE, which simply removes the most extreme price movements each month.
The practical difference: Trimmed Mean PCE currently reads 2.36%, while Core PCE sits at 3.20%. By switching metrics, Warsh isn’t actually lowering prices; he is mathematically moving the goalposts closer to a “victory” on inflation. It’s the same thing I saw in the Army. When the standard couldn’t be met, leadership would just quietly change the standard. It creates a way to justify rate cuts even when the cost of living remains high.
NVDA Earnings (May 20)
All eyes are on NVIDIA (NVDA) earnings this Wednesday after the close. The expectations are massive, with revenue projected near $78 billion. In this market, a “beat” isn’t enough; they need to show the AI build-out is accelerating. If NVDA stumbles, the liquidity the Fed is pumping in might not be enough to hold up the tech sector. We will be doing flow and detailed prep in our Tuesday letter.
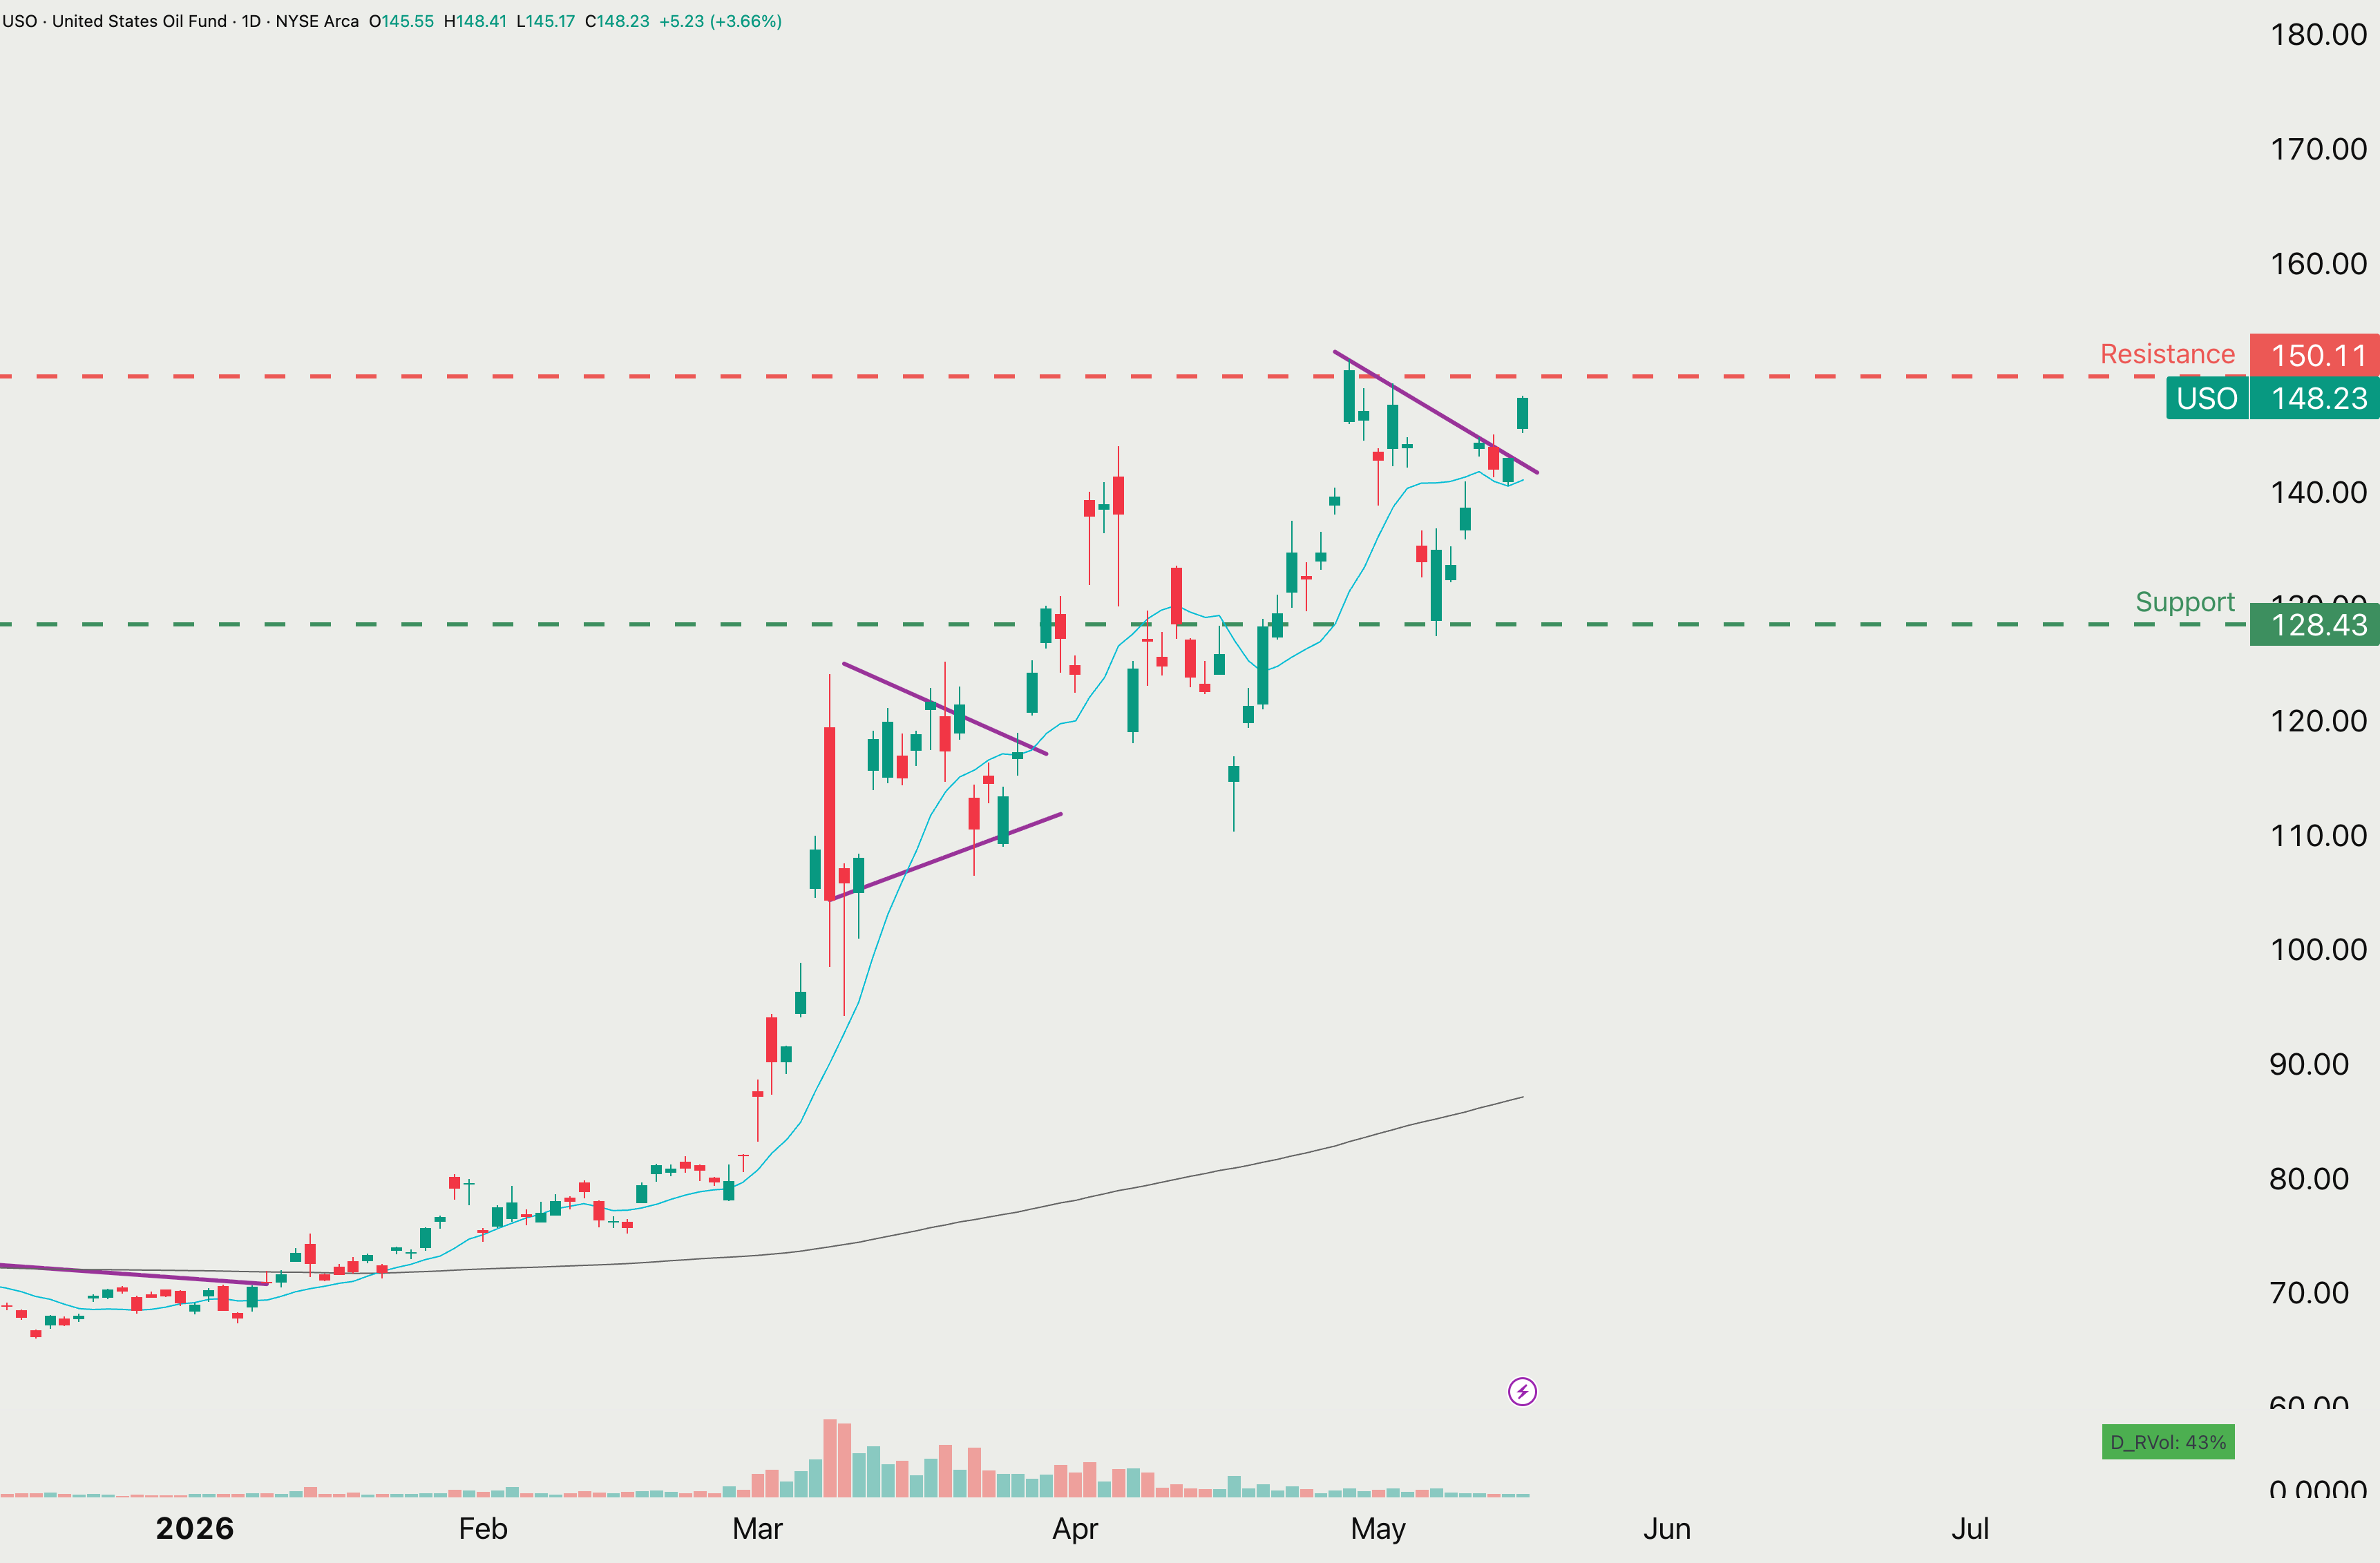
Oil & The Iran Wildcard
WTI crude is near $99 and Brent is over $104, putting us in the “danger zone.” High oil means money spent at the pump is money not spent on tech or travel.
The real wildcard is the Strait of Hormuz. Negotiations with Iran have stalled, and if that passage (where 20% of the world’s oil flows) gets blocked, oil could gap to $150+ instantly. While markets sometimes rally once a conflict actually starts (the “Buy the Cannon” effect), this current uncertainty is a huge weight on global growth.
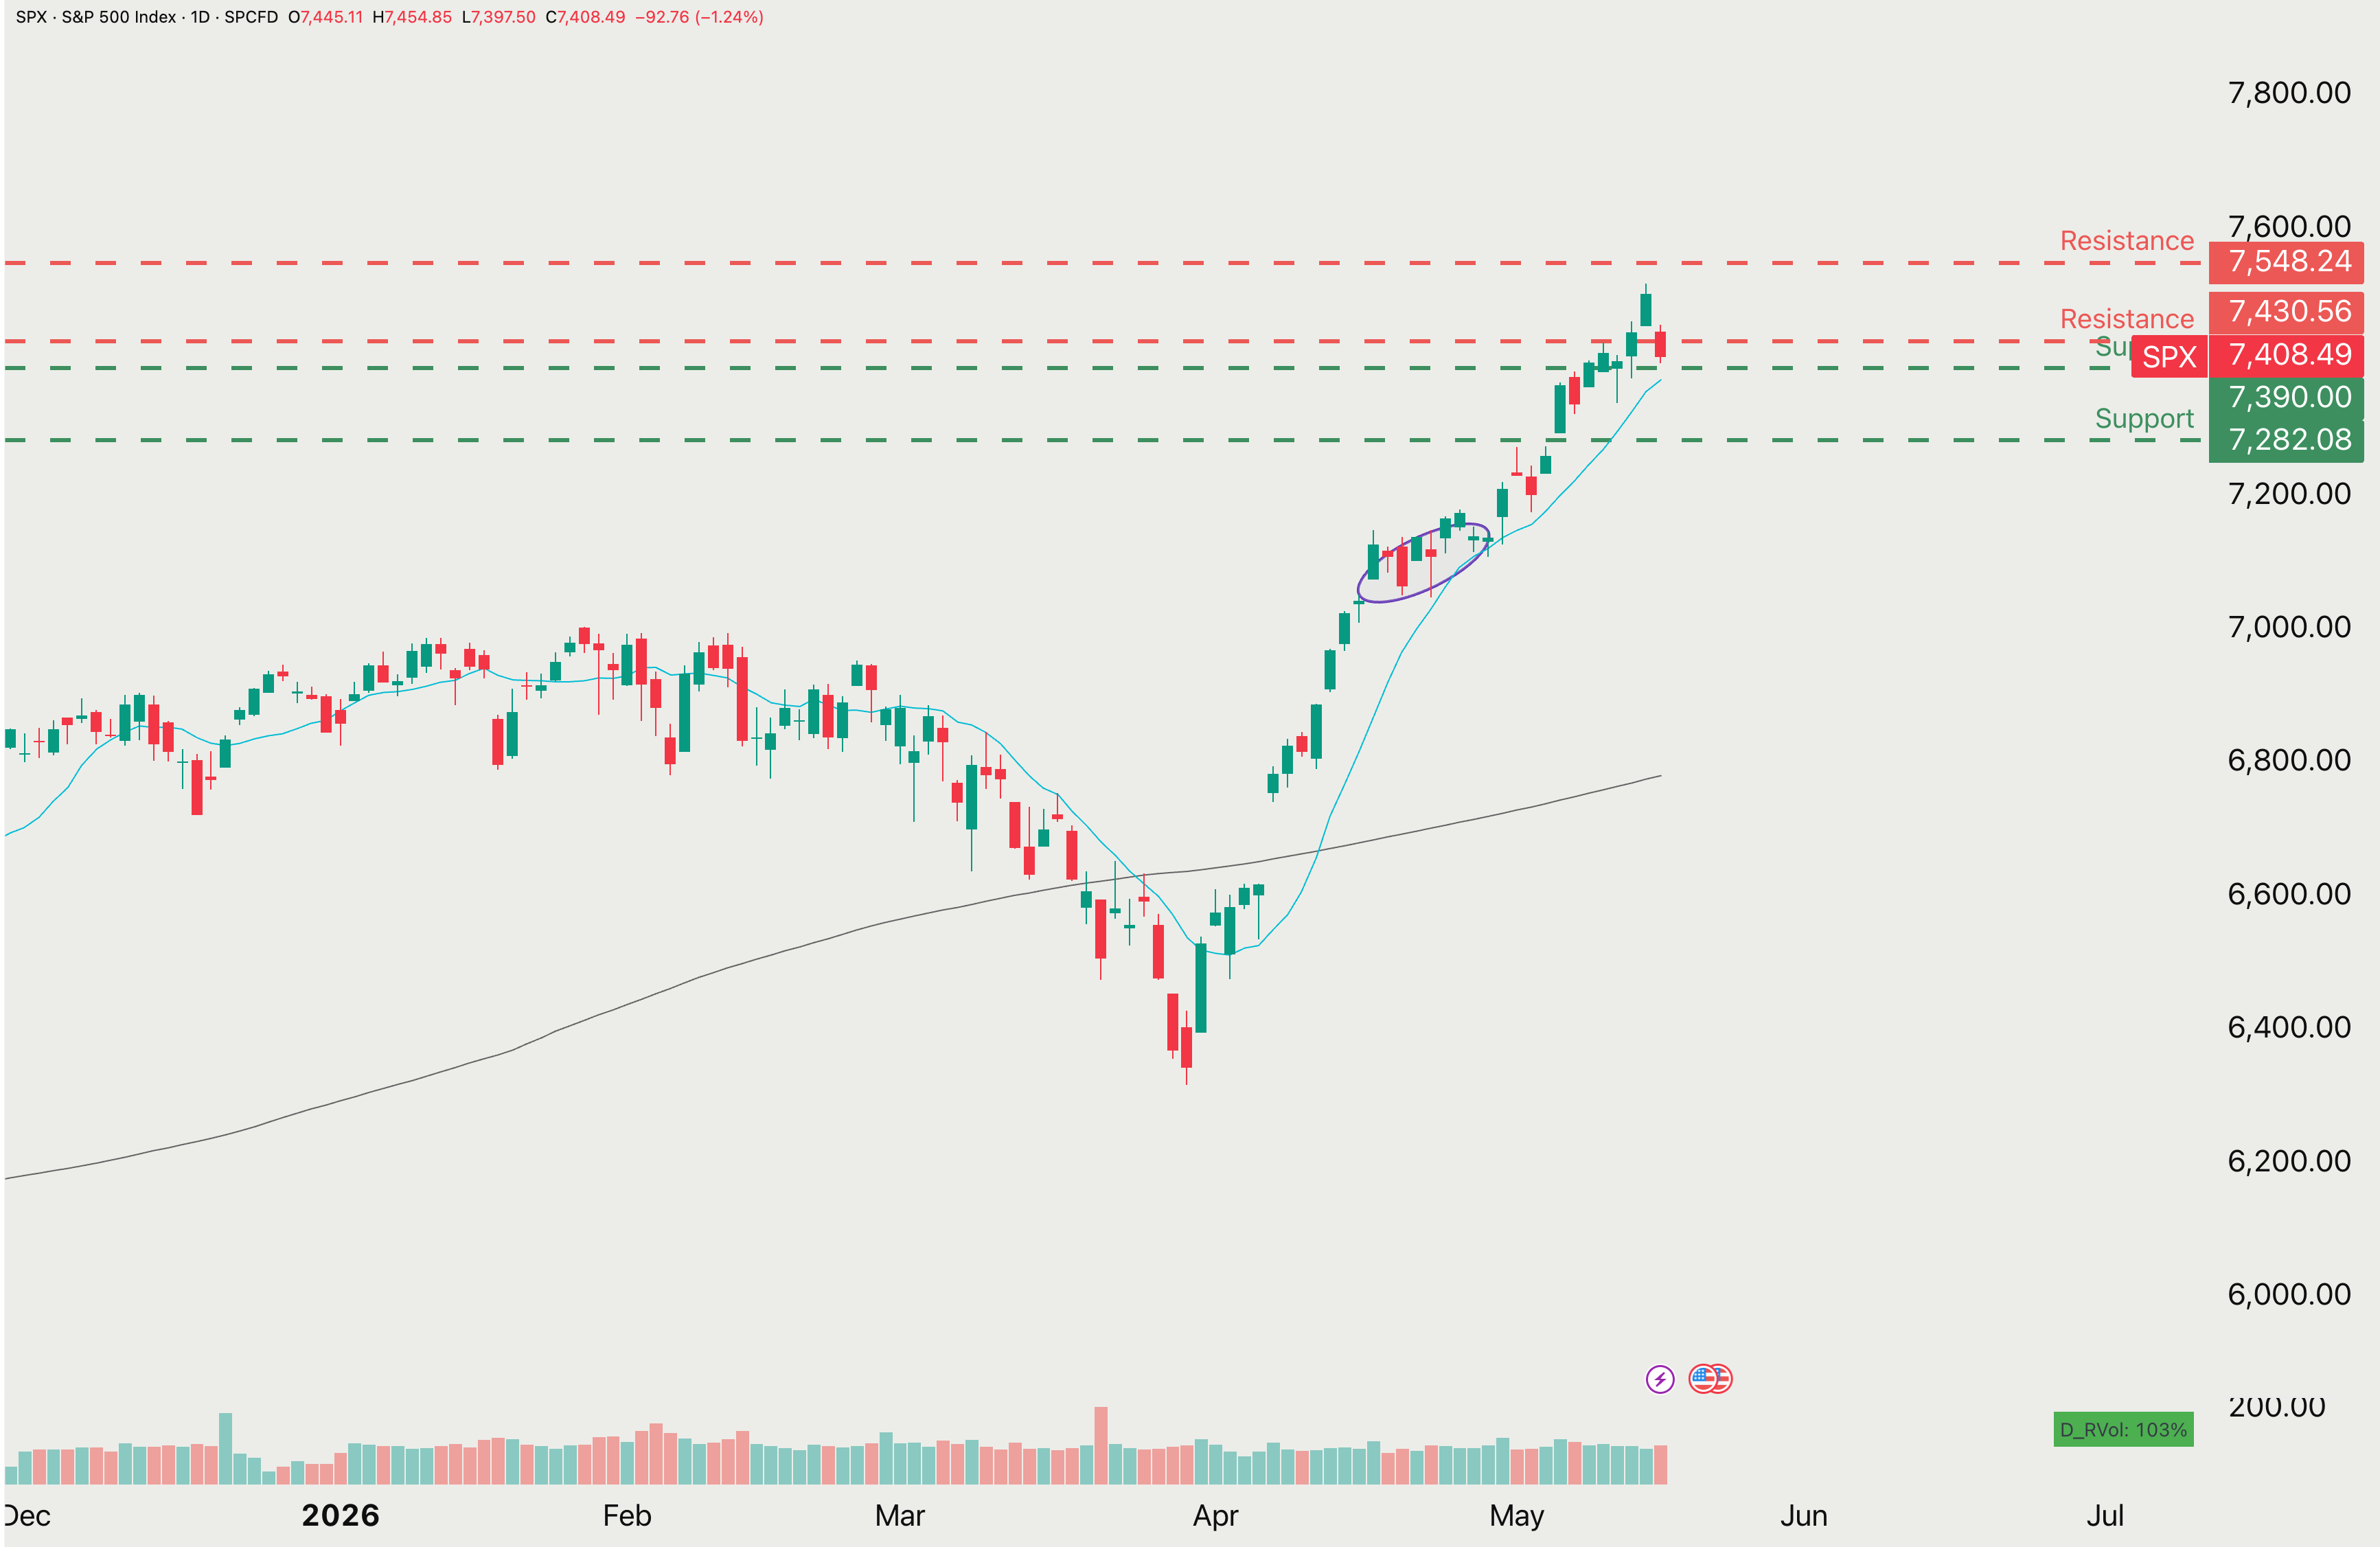
SPX Levels
Looking at the SPX chart, the momentum remains technically bullish, but the “exhaustion” signs are manifesting:
Resistance: The index is currently testing the 10DMA. The resistance levels are 7,430 - 7,548 zone.
Support: 7,390 and 7,282. A breach of these levels would signal that the liquidity high is finally wearing off.