

Hi everyone,
Alessio was busy today and couldn’t send out commodities, we will do so for this weekend with some important buying levels, positioning and technical charts, as some of those are hard to avoid at this point.
Yesterday I laid out what I needed before adding longs: SPX had to reclaim 7,357, retest it, and hold. It got above that level Thursday morning, but buyers couldn’t defend it. That’s why I didn’t enter any of the names on my watchlist as many setups didn’t manage to breakout anyways. The failure was almost immediate and the selling barely stopped all day.
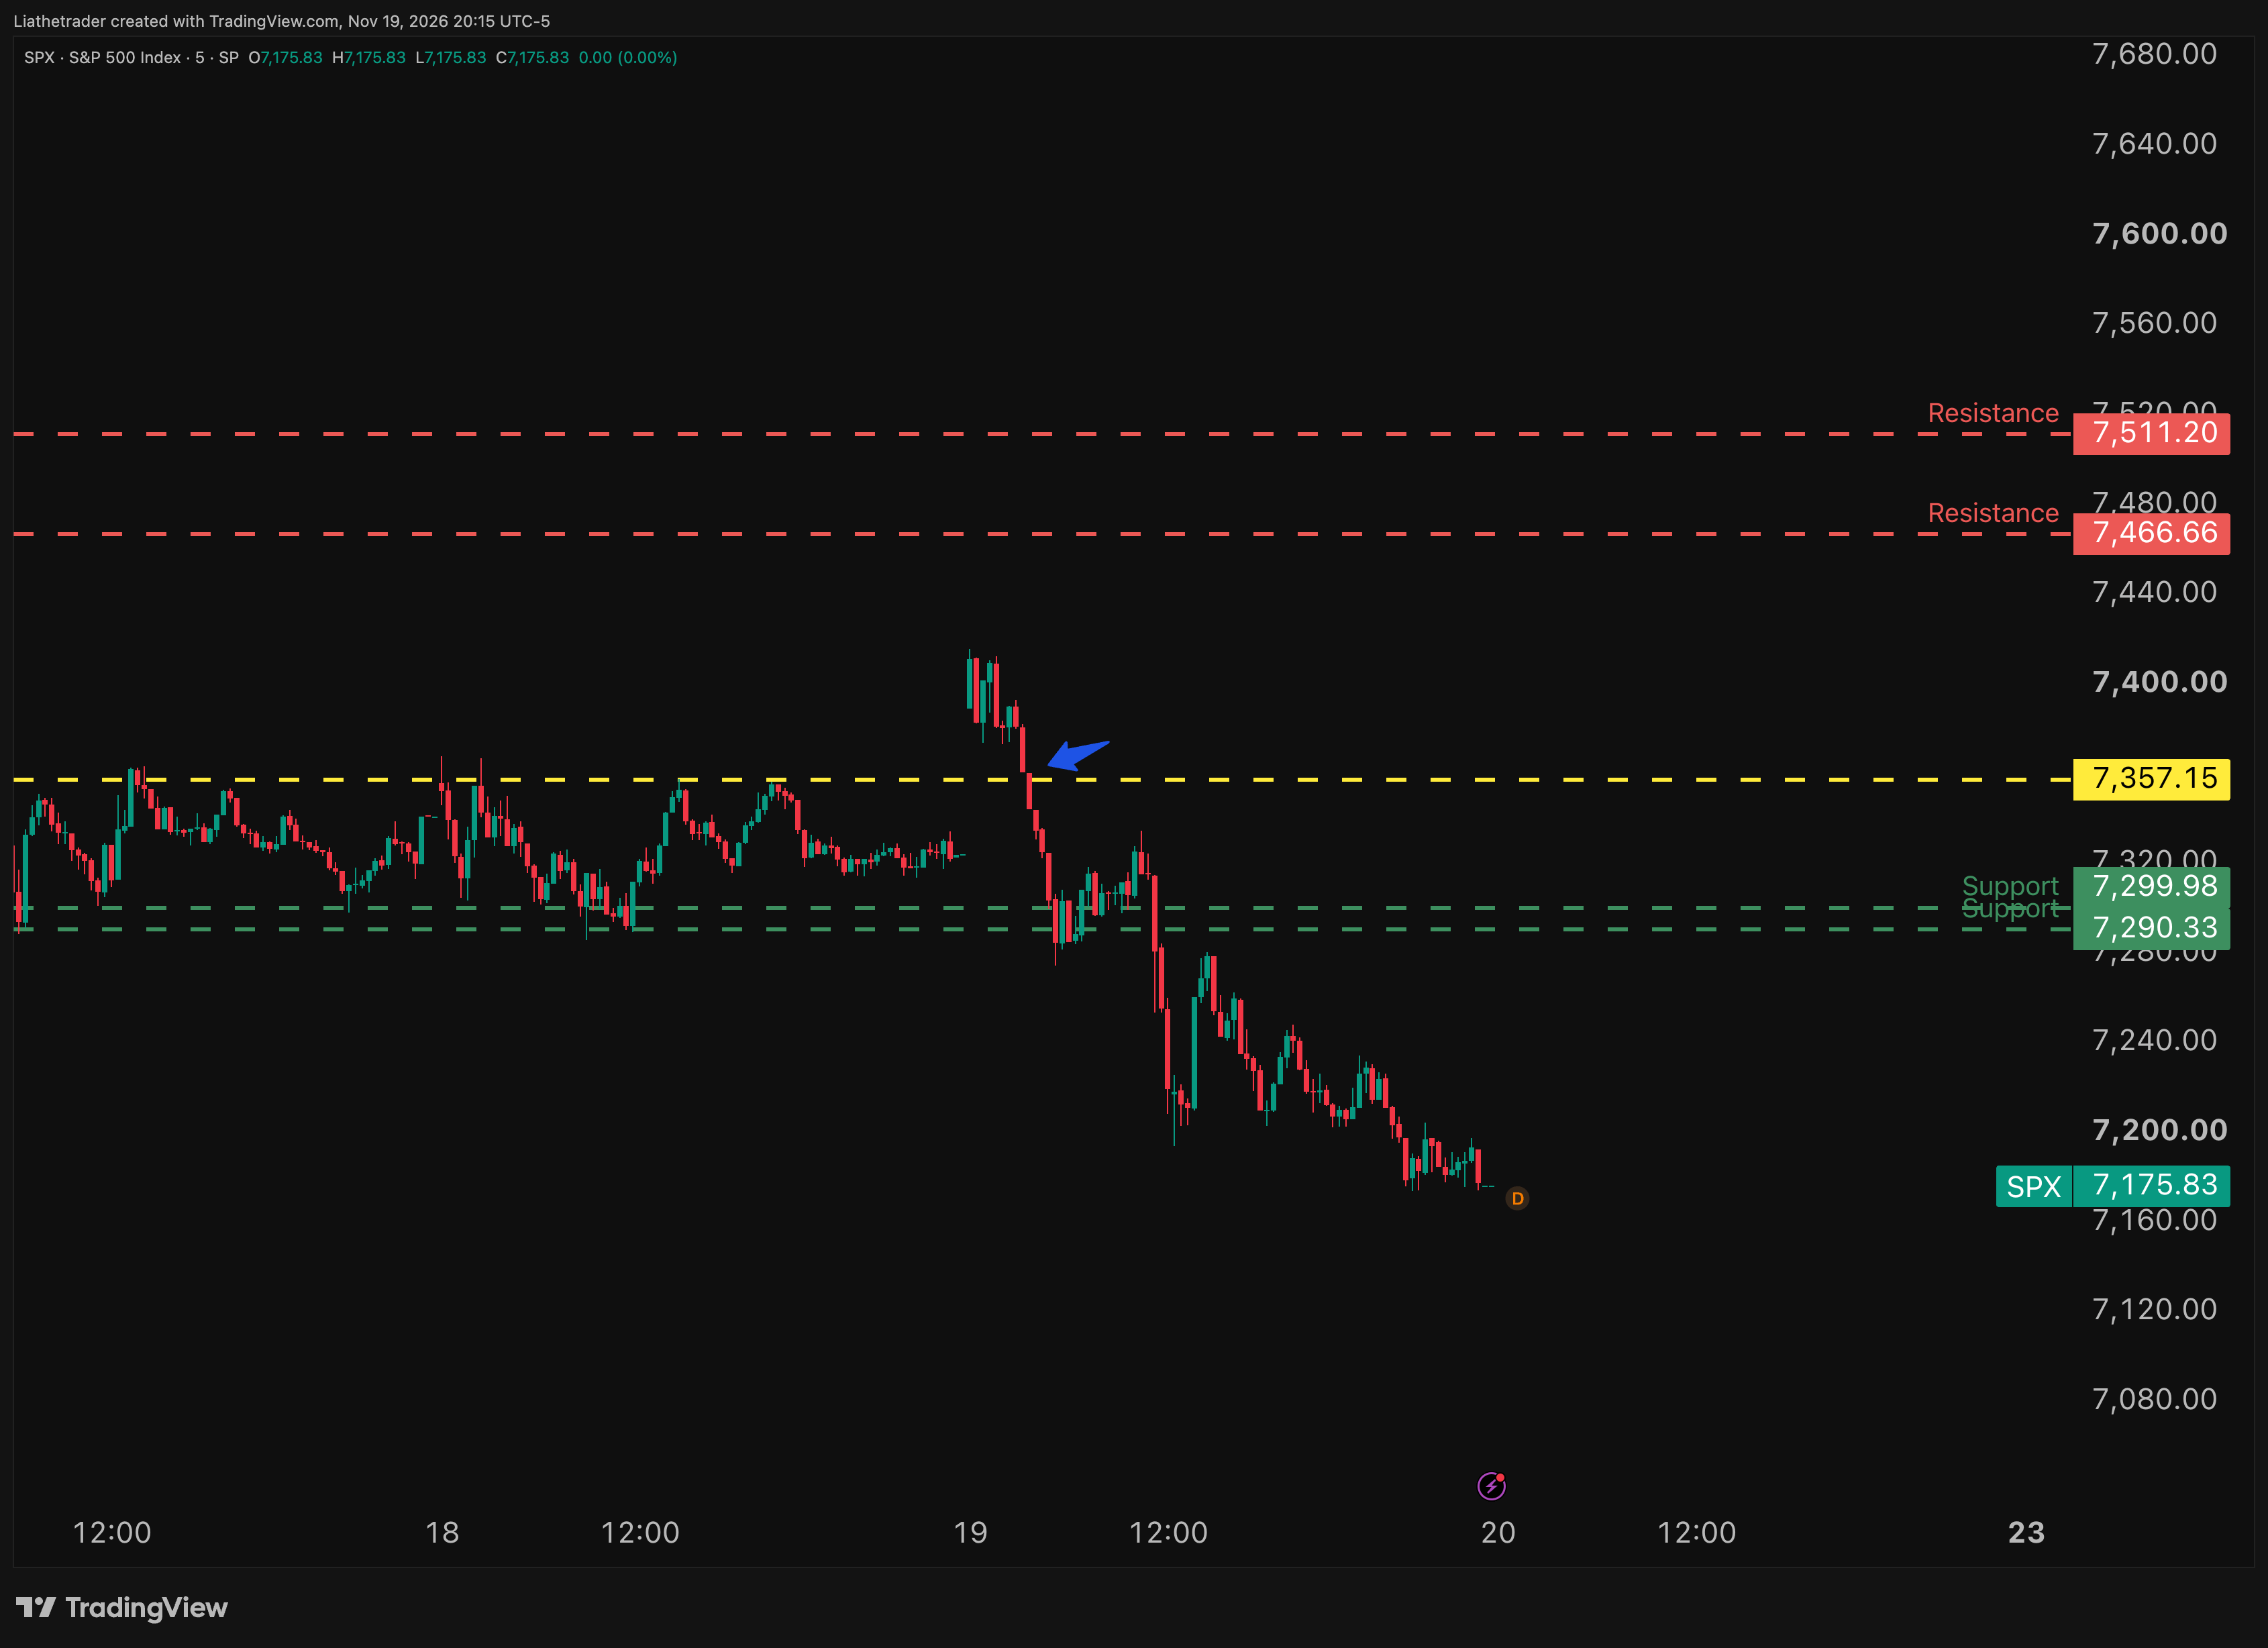
SPX closed near the lows at 7,176, down 2.02%. The Nasdaq Composite fell 2.25%, all 11 sectors finished red, and the VIX jumped nearly 16% by the close. We spoke about VIX contract rolling in our weekly webinar yesterday. We expected the increase in volatility. Please watch the short video here:
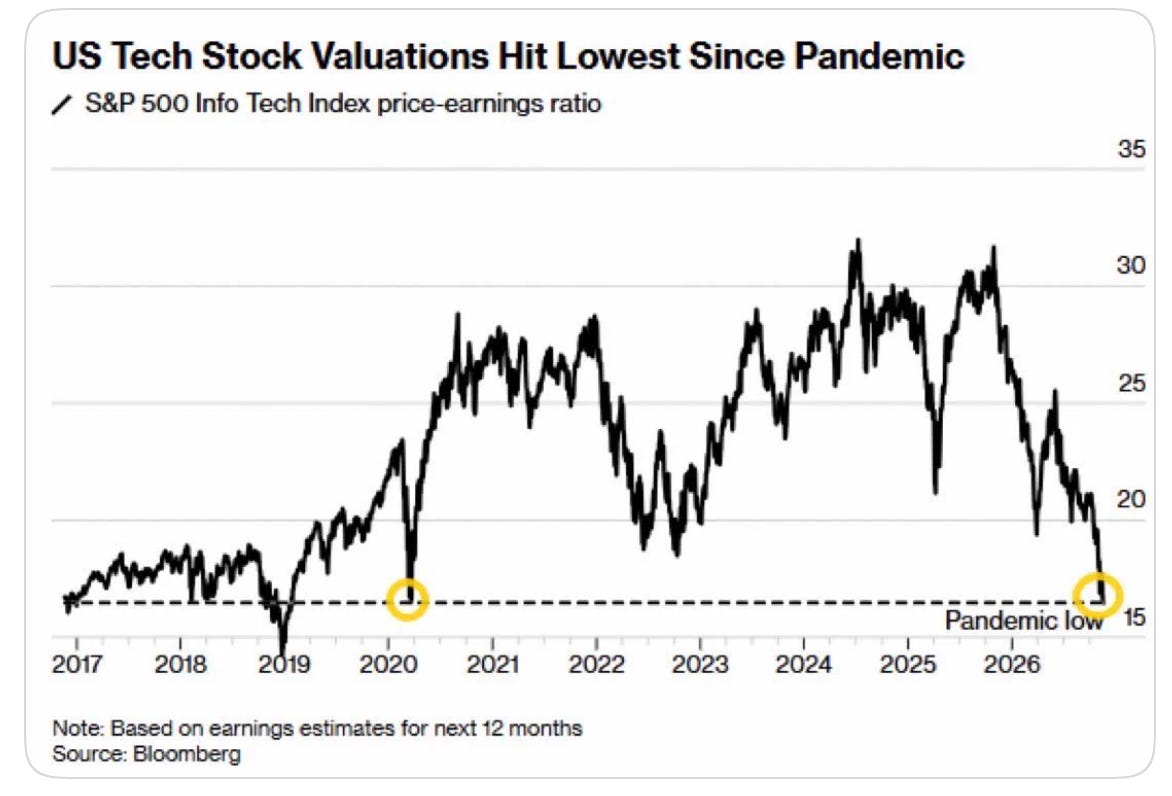
Tech is cheaper. What does that actually mean?
The Bloomberg chart puts the S&P 500 Information Technology sector near its pandemic-era valuation low, at roughly 16–17× forward earnings. FactSet had it at 17.3× on Nov. 5, already the lowest since March 2020 by its measure. This chart tracks the tech sector, not the entire Magnificent Seven. Some names are getting to valuations hard to ignore and below I’ll post some levels of interest on some of our favorite names.
Magnificent Seven valuations: trailing vs. forward P/E
As of the Nov. 19 close. Each pair below is trailing P/E first, then forward P/E.
NVDA: 15.7× / 10.1×
AMZN: 20.8× / 26.0×
GOOGL: 14.2× / 19.8×
TSLA: 411.4× / 175.2×
AAPL: 38.9× / 37.1×
META: 20.3× / 18.1×
MSFT: 26.0× / 24.0x
Trailing P/E uses earnings already reported over the last 12 months. Forward P/E uses earnings estimates. At $160, a stock looks like 16× on $10 of expected earnings. Cut that estimate to $8 and it’s 20× without the price moving at all. Trailing earnings have their own quirks, too: Alphabet said unrealized investment gains drove much of its Q2 earnings jump. The chart tells me tech is cheaper on expected earnings. The question is whether those estimates hold up.
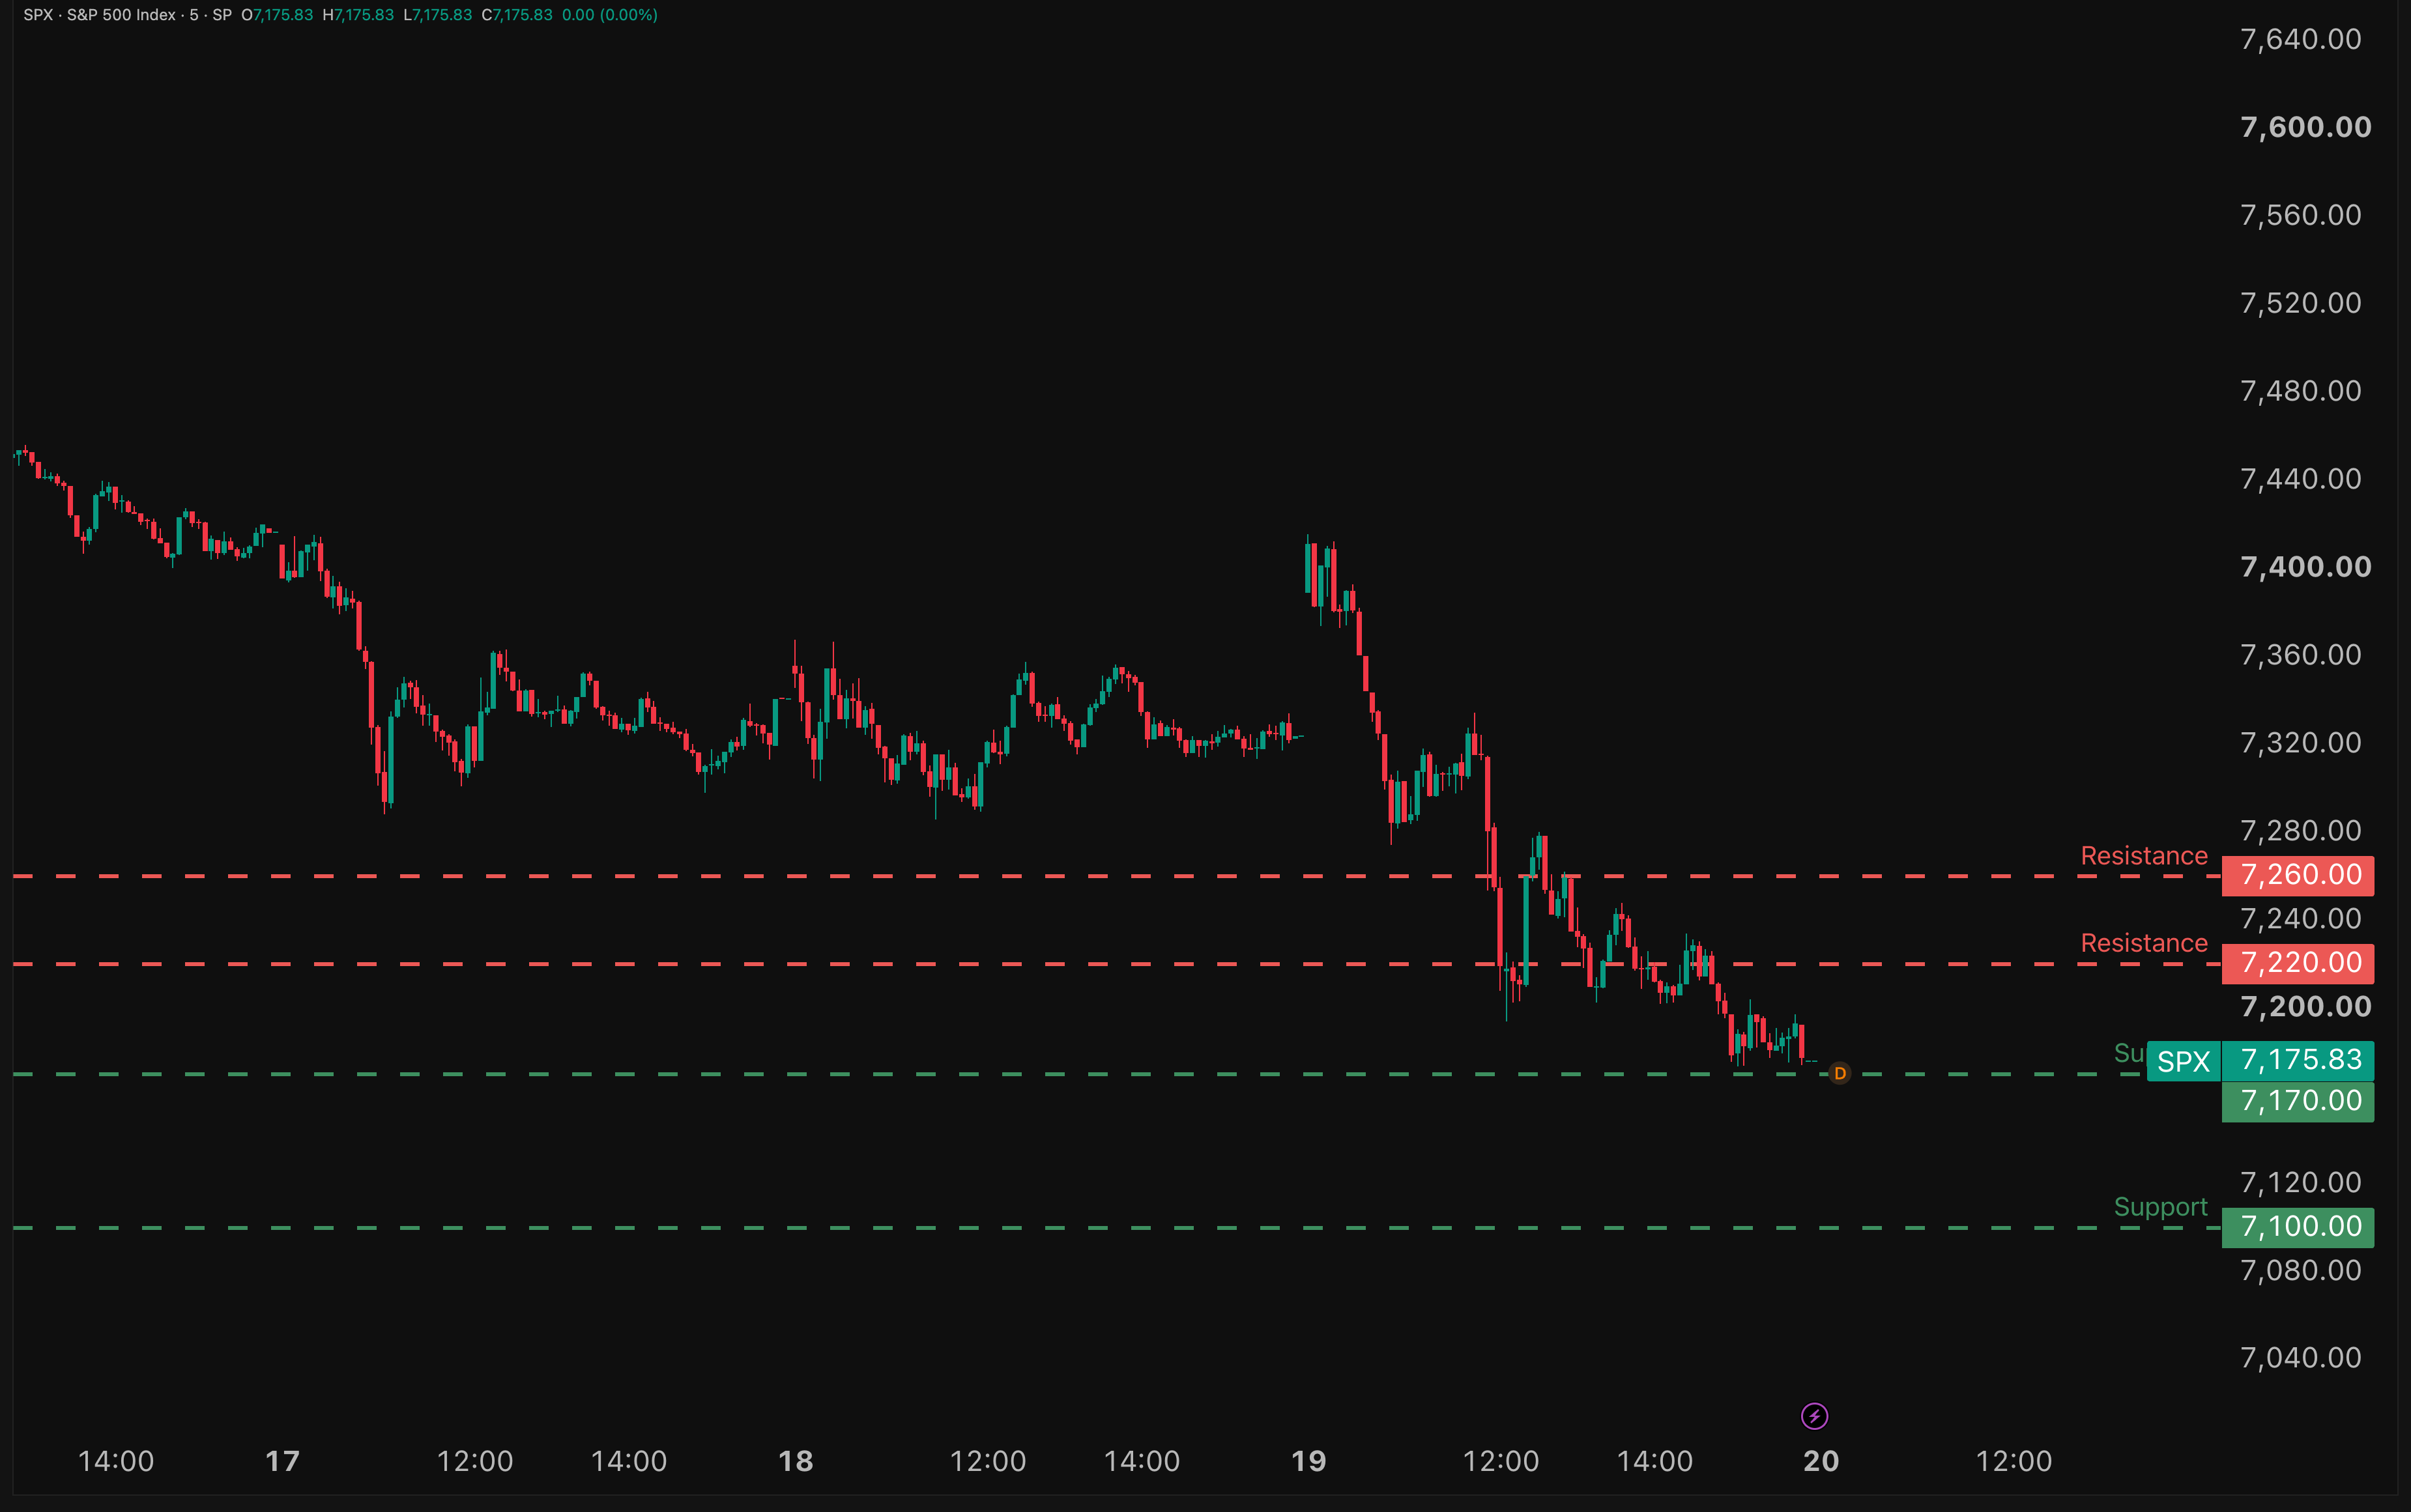
SPX levels
Resistance: 7,220 / 7,260
Support: 7,170 / 7,100
A reclaim of 7,220 that holds puts 7,260 in play. If 7,170 fails, 7,100 is my next round-number reference. Sentiment is oversold, but I’m still waiting for price confirmation.
Six names on my watchlist
Here are the levels I’d be interested adding for long term. I’m not saying it will get there but the sentiment now is really negative and momentum is to the downside. I’ll be patient, and until then I’m going to just trade names from top 10 on TMAD app.
