

Hi everyone,
For the better part of two years, the market has rewarded one story above all others: artificial intelligence. Mega-cap tech has carried the indices, AI-related names have delivered extraordinary gains, and every dip has been bought. Yet beneath the surface of the major indices, a different pattern has started to appear, the same kind of clustered sector rotation that marked the transition from the late-1990s bubble peak into a genuine bear market.
In 2000, the Nasdaq-100 peaked on March 27. Almost immediately afterward, a rare pattern appeared: clusters of days when tech fell hard (2.5%+) while consumer staples rose. These rotation days had been nearly nonexistent during the bubble’s inflation. The first cluster was followed by a 36% drop, a strong summer bounce, and then a second cluster that preceded a much deeper decline. The clusters marked the shift from correction to bear market as institutions systematically reduced exposure to the dominant theme.
A similar pattern has started to show up in the current AI trade. Two rotation clusters have appeared this year, one in early summer and another in mid-October. Many AI-related names are already down 50%+ from their peaks even as the major indices stay near highs. When the lens is narrowed to semis versus staples, the signal is the same.
1. June 5 – July 2 Cluster
This was the first notable cluster of the year.
Key days:
June 5: XLK fell –6.66%. QQQ dropped from ~$740 to $705. This was one of the sharpest single-day tech declines of the year and kicked off the cluster. Defensive sectors held up or rose while tech was hit hard.
Multiple sessions in the following weeks showed the same pattern (tech down, staples/defensives up). One clear example on June 23: XLK –3.36%, XLP +1.65%.
Over the full window, tech was under pressure while staples and other defensives absorbed capital. The period ended with QQQ still well below its early-June levels.
This matched the article’s “cluster” definition — multiple rotation-style days in a relatively short window rather than isolated one-off moves.
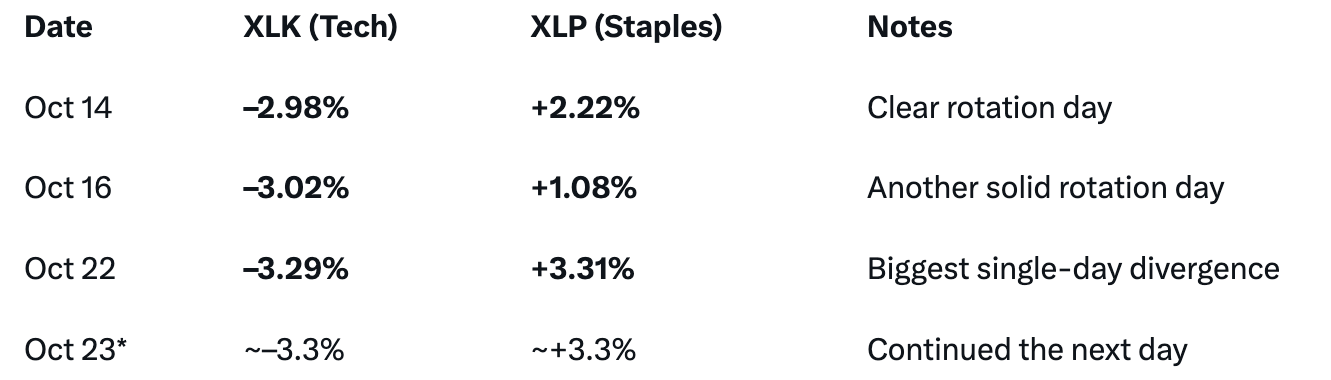
2. October 14–22 Cluster (the one “we just saw”)
This was the second clear cluster and was more visible in real time.
Notable rotation days in the window:
The AI revolution is real. The risk is that financial conditions tighten or risk appetite fades before the productivity gains become broad enough to support the valuations priced in during the euphoria. When large institutions begin reducing exposure to the leading theme while still absorbing new supply, price action itself can feed into tighter conditions.
Most portfolios that rode the AI wave hard have little defensive ballast. Consumer staples have historically been where capital rotates when growth and tech come under pressure. The purest AI and high-beta growth names are the most sensitive to a sustained version of this shift. Thus for the past 3 months we’ve been posting and restructuring our portfolios on less high-beta, more quality names and some defensives/ financials, etc.
This doesn’t require calling a crash. Dead-cat bounces are common after the first wave of selling. What the data suggests is that once these rotations cluster, the market’s character often changes. Watching the frequency of tech/semis-down, staples-up days, the breadth of new highs, and whether institutions are still adding or quietly redistributing is more useful than trying to time an exact top. The resilience of the AI trade has been remarkable. The question is whether that resilience is starting to thin out beneath the surface the way it did in 2000.
Already for week, and also yesterday we saw huge flow into names like:
