

Hi traders,
NASDAQ in new all-time-highs. NVDA in all-time-highs. The markets are priced for an economy that stays hot, while the labor and oil data say that bet is late in the cycle.
Equities and bonds are making the same wager from opposite sides. A reocrd share of S&P 500 stocks carry analyst Buy ratings, and trend-followers are the most short government bonds they have ever been. Stocks are betting on growth; bonds are betting on inflation and fiscal stress, with the 10-year assumed to stay above 5%.
Gas and diesel have jumped since the Iran strikes. That works like a tax: money spent on fuel is money not spent on other things. Oil spikes have come before several past recessions.
Inflation outside energy is already low, around 2.4%. The Fed raised rates anyway and may do it again. That means tighter policy on top of the hit from higher fuel costs.
The bonds will most likely rally. Deficits can push yields up in the middle of a cycle, but when growth and inflation cool, investors usually buy Treasuries for safety. A 30-year bond yielding over 5.6% while core inflation is 2.4% looks attractive if a slowdown is starting.
It could be wrong if the economy stays strong, AI spending keeps booming, or oil spikes again and pushes rates higher first. The things to watch are jobs reports, inflation, the Fed’s late-October decision, and whether company borrowing costs start to rise.
For us, using TMAD APP, none of this should concern us for short- or mid-term trading. We have restructured long term portfolios and only hold names we’re comfortable to go through a drawdown and buy more of. (If we have a drawdown).
With the rest of the money, we’re trading. Our TMAD scanner is showing excellent trades on a daily basis, and we’re getting great feedback from our members.
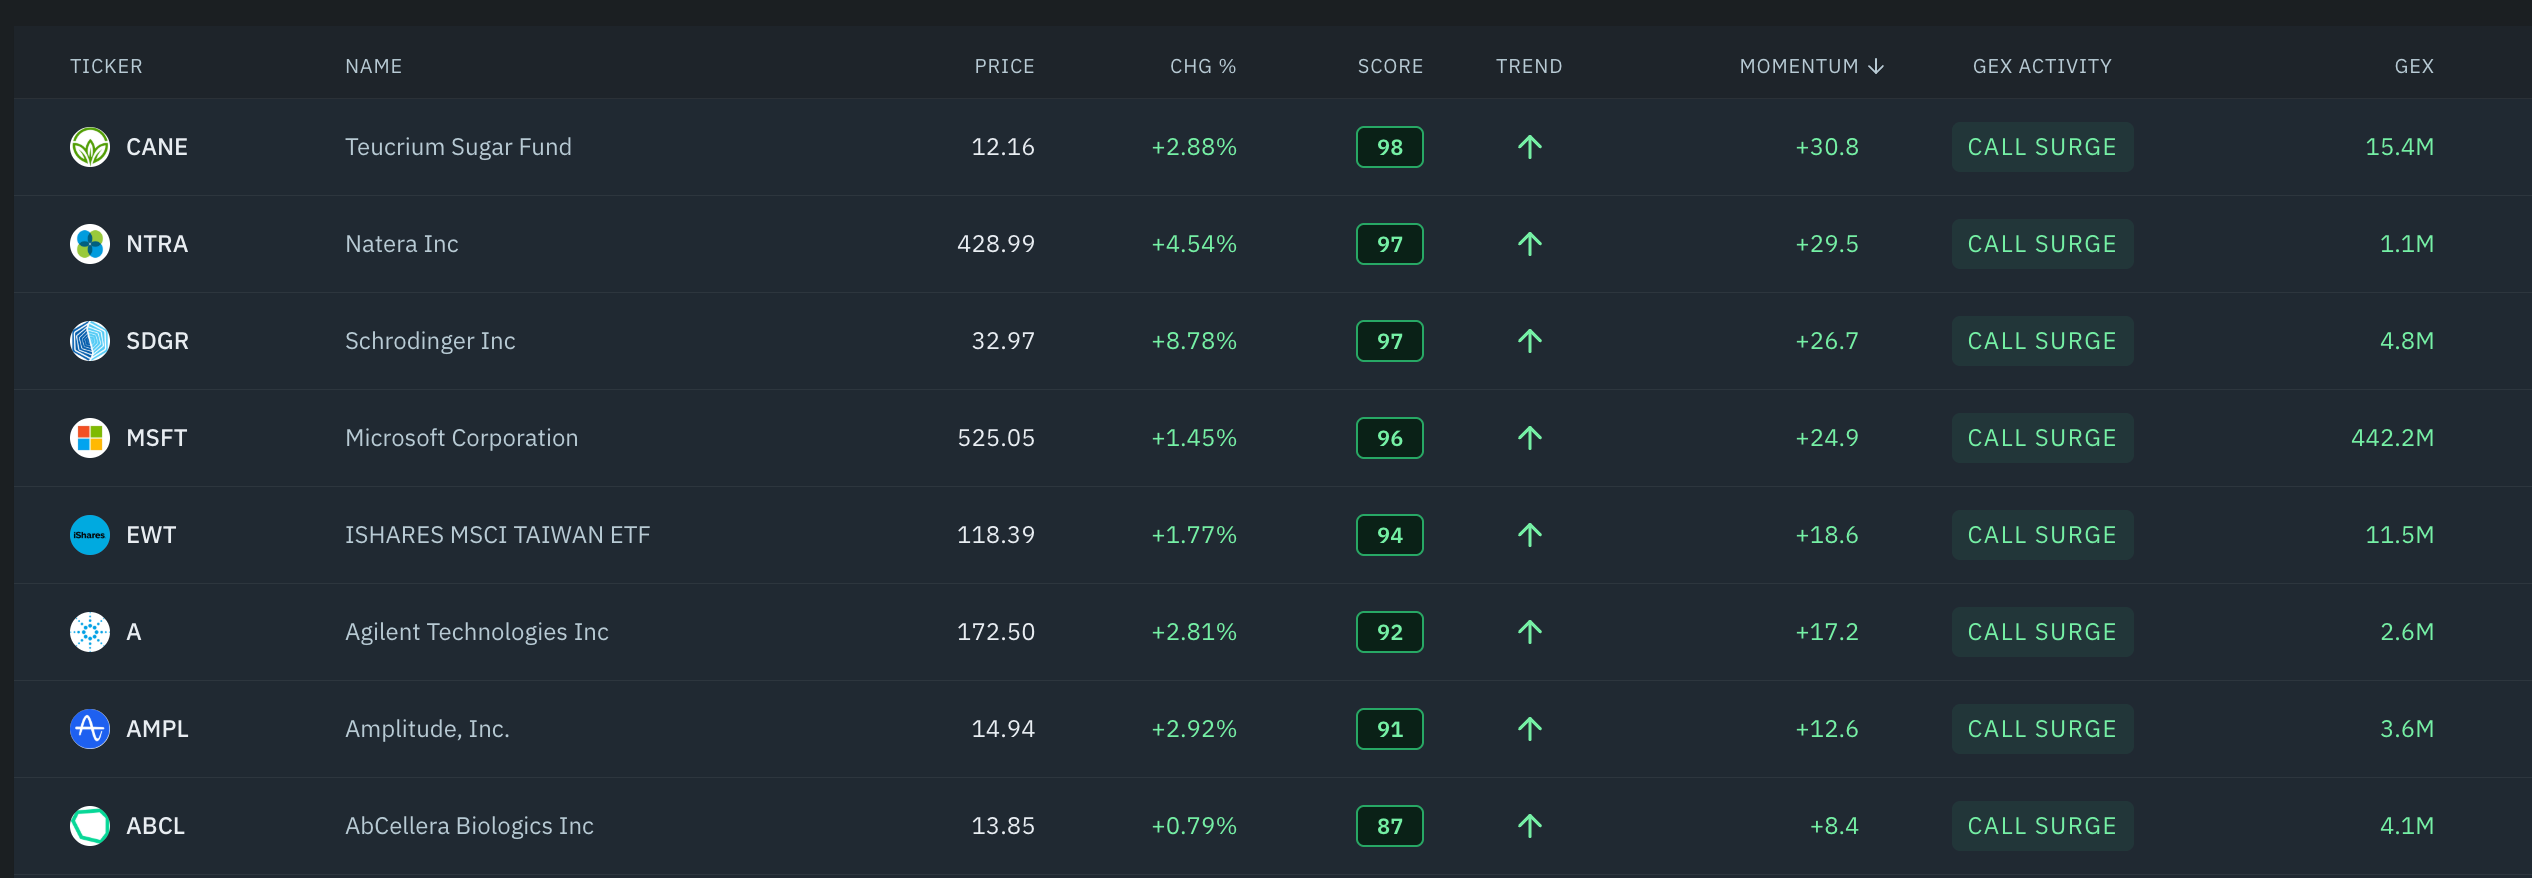
Besides the top 10 score, you can search under Scanner, choose the columns you want to see. The best bet is Uptrend, highest Momentum, GEX activity showing a CALL SURGE, and positive GEX. There you’ll find the top names, which you can then choose from based on the technical charts and your style of trading.
Let’s now look at SPX levels and trade ideas.
