
TMAD Weekly: Rotations, GEX by Expiry Addition and Short List
$M $MP

Hi everyone,
Last week, we added GEX by Expiry to our TMAD App. It’s an excellent tool for trading and investing as well, because you can distinguish real movement from noise and see the allocation of smart money.
What does it mean and how to use it?
When looking at GEX by expiry, it’s helpful to break it down by time frame rather than just the total number. Here’s the simple way to think about it:
Short-term (next 1 month): This is mostly market makers doing forced hedging. When prices move, they have to adjust their positions quickly to stay neutral. This creates a lot of short-term noise and can push the market around even if there’s no real conviction behind the move.
Mid-term (3 to 6 months): Here, you start seeing more hedge funds and speculative money. These players are usually taking directional bets, so this timeframe gives you a better read on where the market/stock price might be heading over the next few months.
Long-term (6+ months, including LEAPS*- options contracts with expiry longer than 12 months). This reflects what big institutions are actually committed to. These positions tend to be more stable and act as the real foundation of the market.
By splitting GEX into these buckets, you can separate the short-term hedging noise from the stronger, more meaningful positioning. It helps you see who is being forced to act versus who is actually betting with conviction.
Let’s look at, TSLA 0.00%↑ for example:
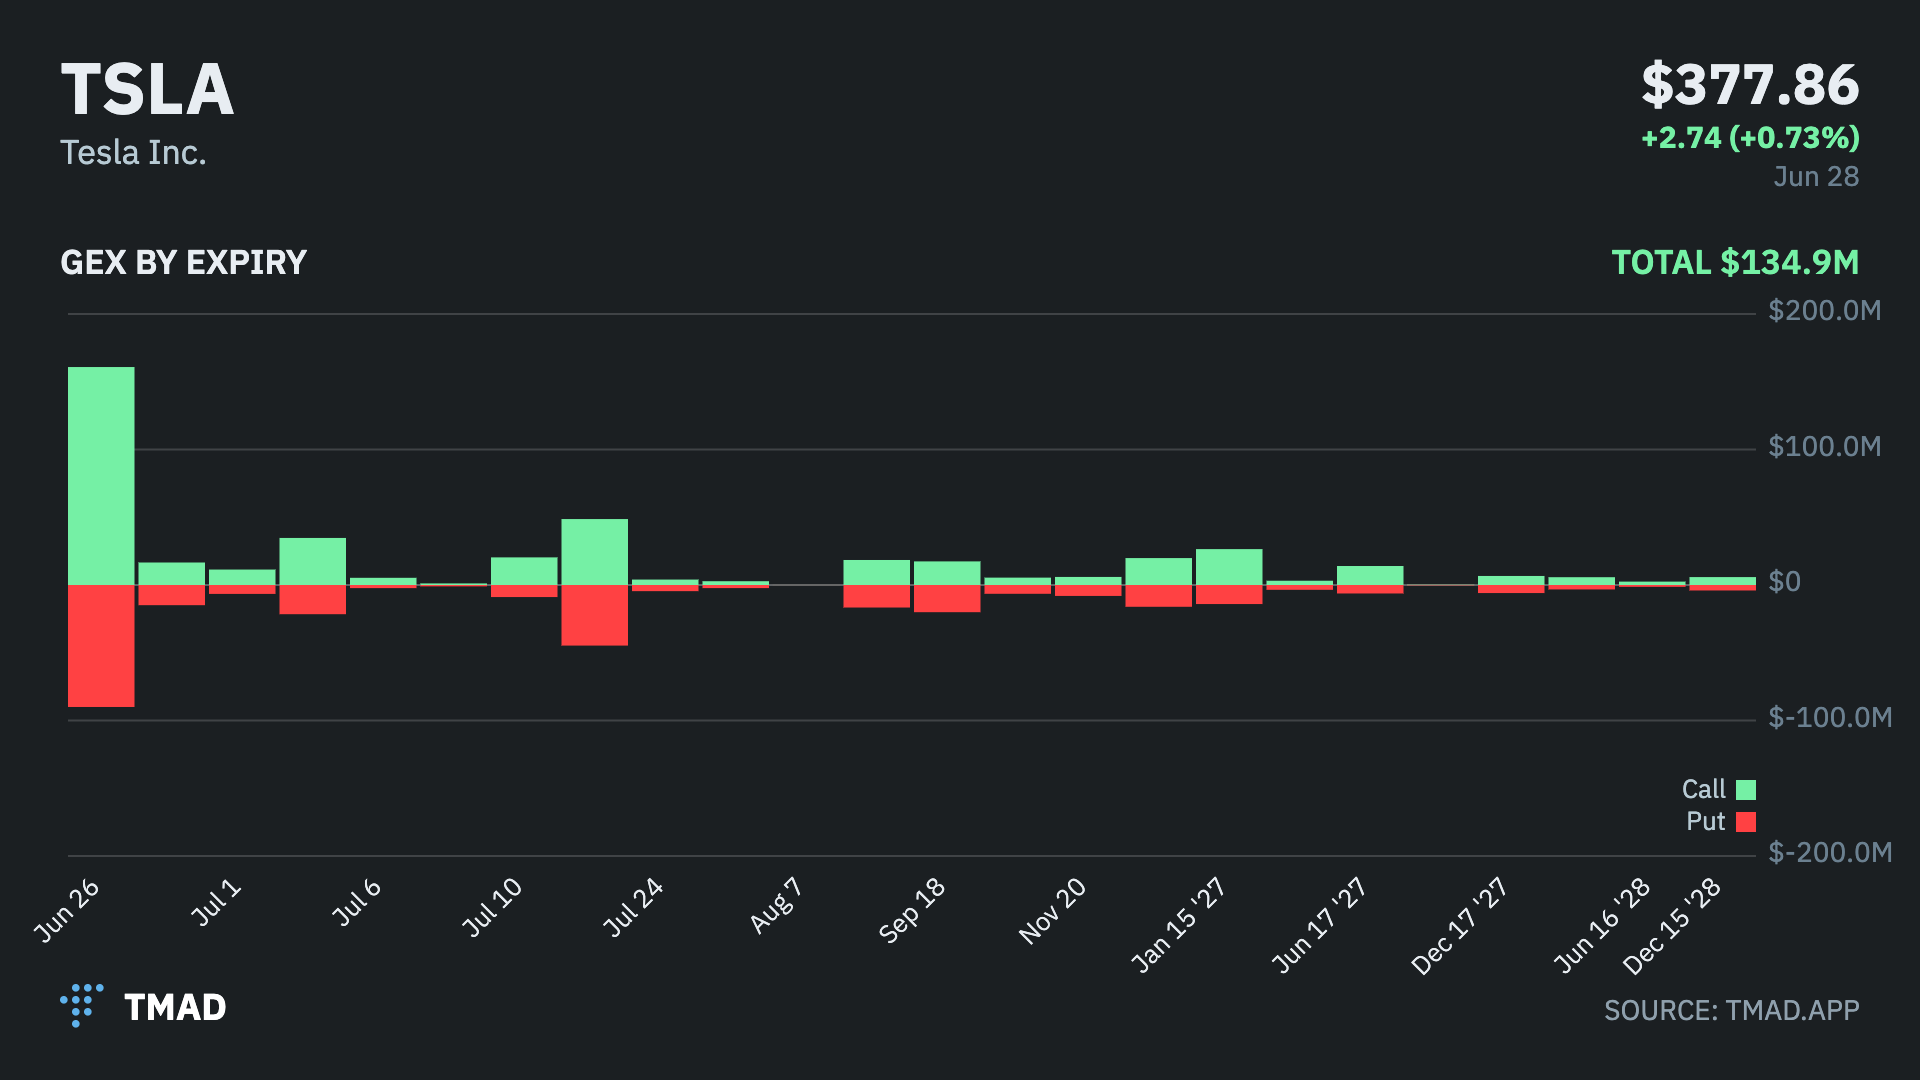
1. Short-term (This week – Jun 26 expiry)
This is by far the biggest bar on the chart.
Very large positive GEX, mostly from calls.
This means market makers are long gamma in the very near term. They will likely buy dips and sell rips aggressively this week. It acts as a stabilizing force and can make big moves harder to sustain in either direction.
2. Next few weeks (Late June – Mid July)
Mostly small bars.
The negative gamma around Jul 17 is the main thing to watch. If the price starts moving hard into that expiry, moves could become more violent.
Longer-term gamma is not providing any strong directional bias.
In simple terms:
The chart says “near-term support is strong, but watch mid-July for potential volatility.” The big positive gamma this week is currently the dominant force.
3. Longer-term (August and beyond)
The bars get much smaller and are mostly mildly positive.
No major negative gamma clusters in the back months.
This shows that big institutional positioning further out is relatively balanced and not heavily one-sided.
Last chance to lock in our current pricing.
In just 2 weeks, we’ll be raising the price of our scanner. This is your final opportunity to secure the current rate of $59/month and get grandfathered in forever, meaning your price will never increase, no matter how much we improve the app.
We’re constantly adding new features, testing strategies, and pushing the scanner forward. Running live data, maintaining the engineering team, and covering token costs isn’t cheap, and as we keep getting better, our costs rise too. That’s why the price is going up.
But if you lock in now, you’ll be protected as one of our original users. For the best value, we recommend going yearly; you’ll get an even bigger discount while locking in the low rate permanently.
Don’t wait until the price increases. Secure your spot at the current rate today.
TOP 10 Strategy
We currently have 2 baskets open:
June 11, which we opened on June 12.
Currently up 0.74% in opposition to SPY being down 1.43%.

June 22, which we opened on June 23.
Currently up 5.1% in opposition to SPY being down 0.5%.

TOP 10 Trade Ideas for Tomorrow:
As you can see on our scanner, the TOP 10 is shifting away from tech and semiconductors towards other sectors:
