
TMAD Weekly: SPY Extreme Valuations & AI Capex Volatility
$ASML $HPE $SNDK $CAVA $GEO

Hi Readers,
The S&P 500 is currently trading at extreme valuations by almost every major measure. Six different valuation frameworks, spanning revenue, assets, earnings, and long-term smoothed data, all show the market at or near multi-decade highs. There is virtually no disagreement between the metrics.
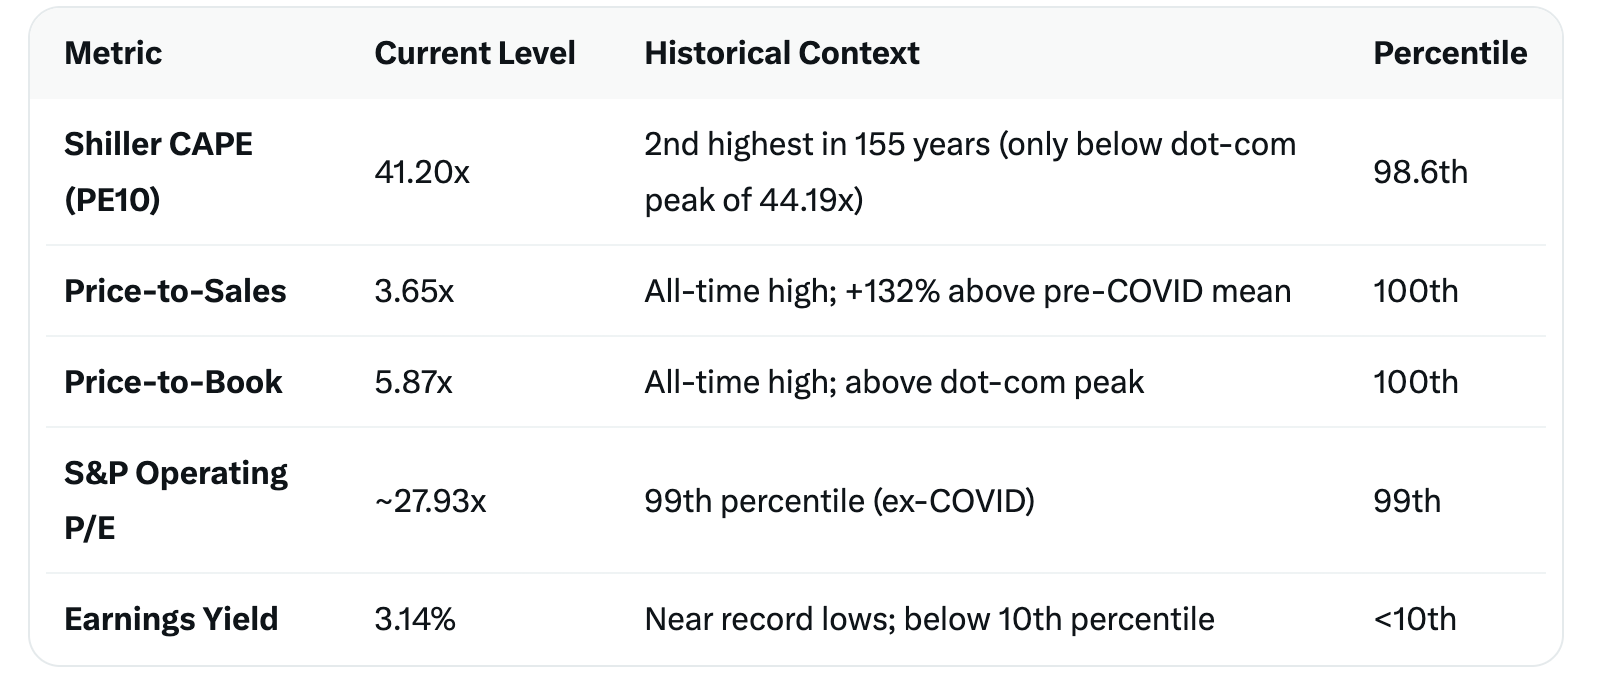
Revenue cannot be manipulated through accounting choices, yet the market trades at 3.65x sales, more than double the pre-2020 peak. Price-to-Book has also broken above the dot-com bubble high. Even when using smoothed, inflation-adjusted earnings through the Shiller CAPE, the reading of 41.20x remains extraordinarily elevated.
Real (inflation-adjusted) earnings per share are at record highs. However, prices have risen faster than earnings. The market is effectively pricing in continued strong margin expansion for years to come.
All six metrics converge on the same conclusion despite using different methodologies and timeframes. This consistency strengthens the signal. The only comparable period in modern history was the late 1990s dot-com bubble.
TMAD View
We view current valuations as stretched across the board. While strong earnings have supported the market, the combination of record-high multiples and limited room for further re-rating creates an asymmetric risk profile.
History shows that periods when multiple independent valuation measures simultaneously sit at extreme levels have typically been followed by below-average forward returns. The current setup is no exception in our view.
Investors should treat the market as expensive rather than cheap. Any further upside from here will likely need to come almost entirely from earnings growth rather than multiple expansion.
AI Capex Volatility
Hyperscalers like Google, Amazon, Microsoft, and Meta are still pouring massive capital into AI infrastructure, with Goldman Sachs analysts projecting around $920 billion in spending for 2027, though actual outlays could reach $1.1–1.4 trillion as companies overspend in ways reminiscent of historical buildouts such as railroads and automobiles.
This higher spending would supercharge revenue for the “picks and shovels” providers of AI (chips like Nvidia, data center builders, power equipment, etc.), likely driving further short-term stock gains even as many of these names already trade at elevated valuations.
We are still in a momentum-driven market where regular companies have yet to show widespread, quantifiable AI-driven profits, creating clear winners and losers as adoption remains in its early stages.
These are all the reasons why, for now, we will focus mainly on trading momentum, which is clearly visible on our TMAD App, and our Score algorithmic trading comes in handy.
We don’t get stuck in names that are not moving, or even worse, moving lower. And there are plenty of those!
Market Pullback
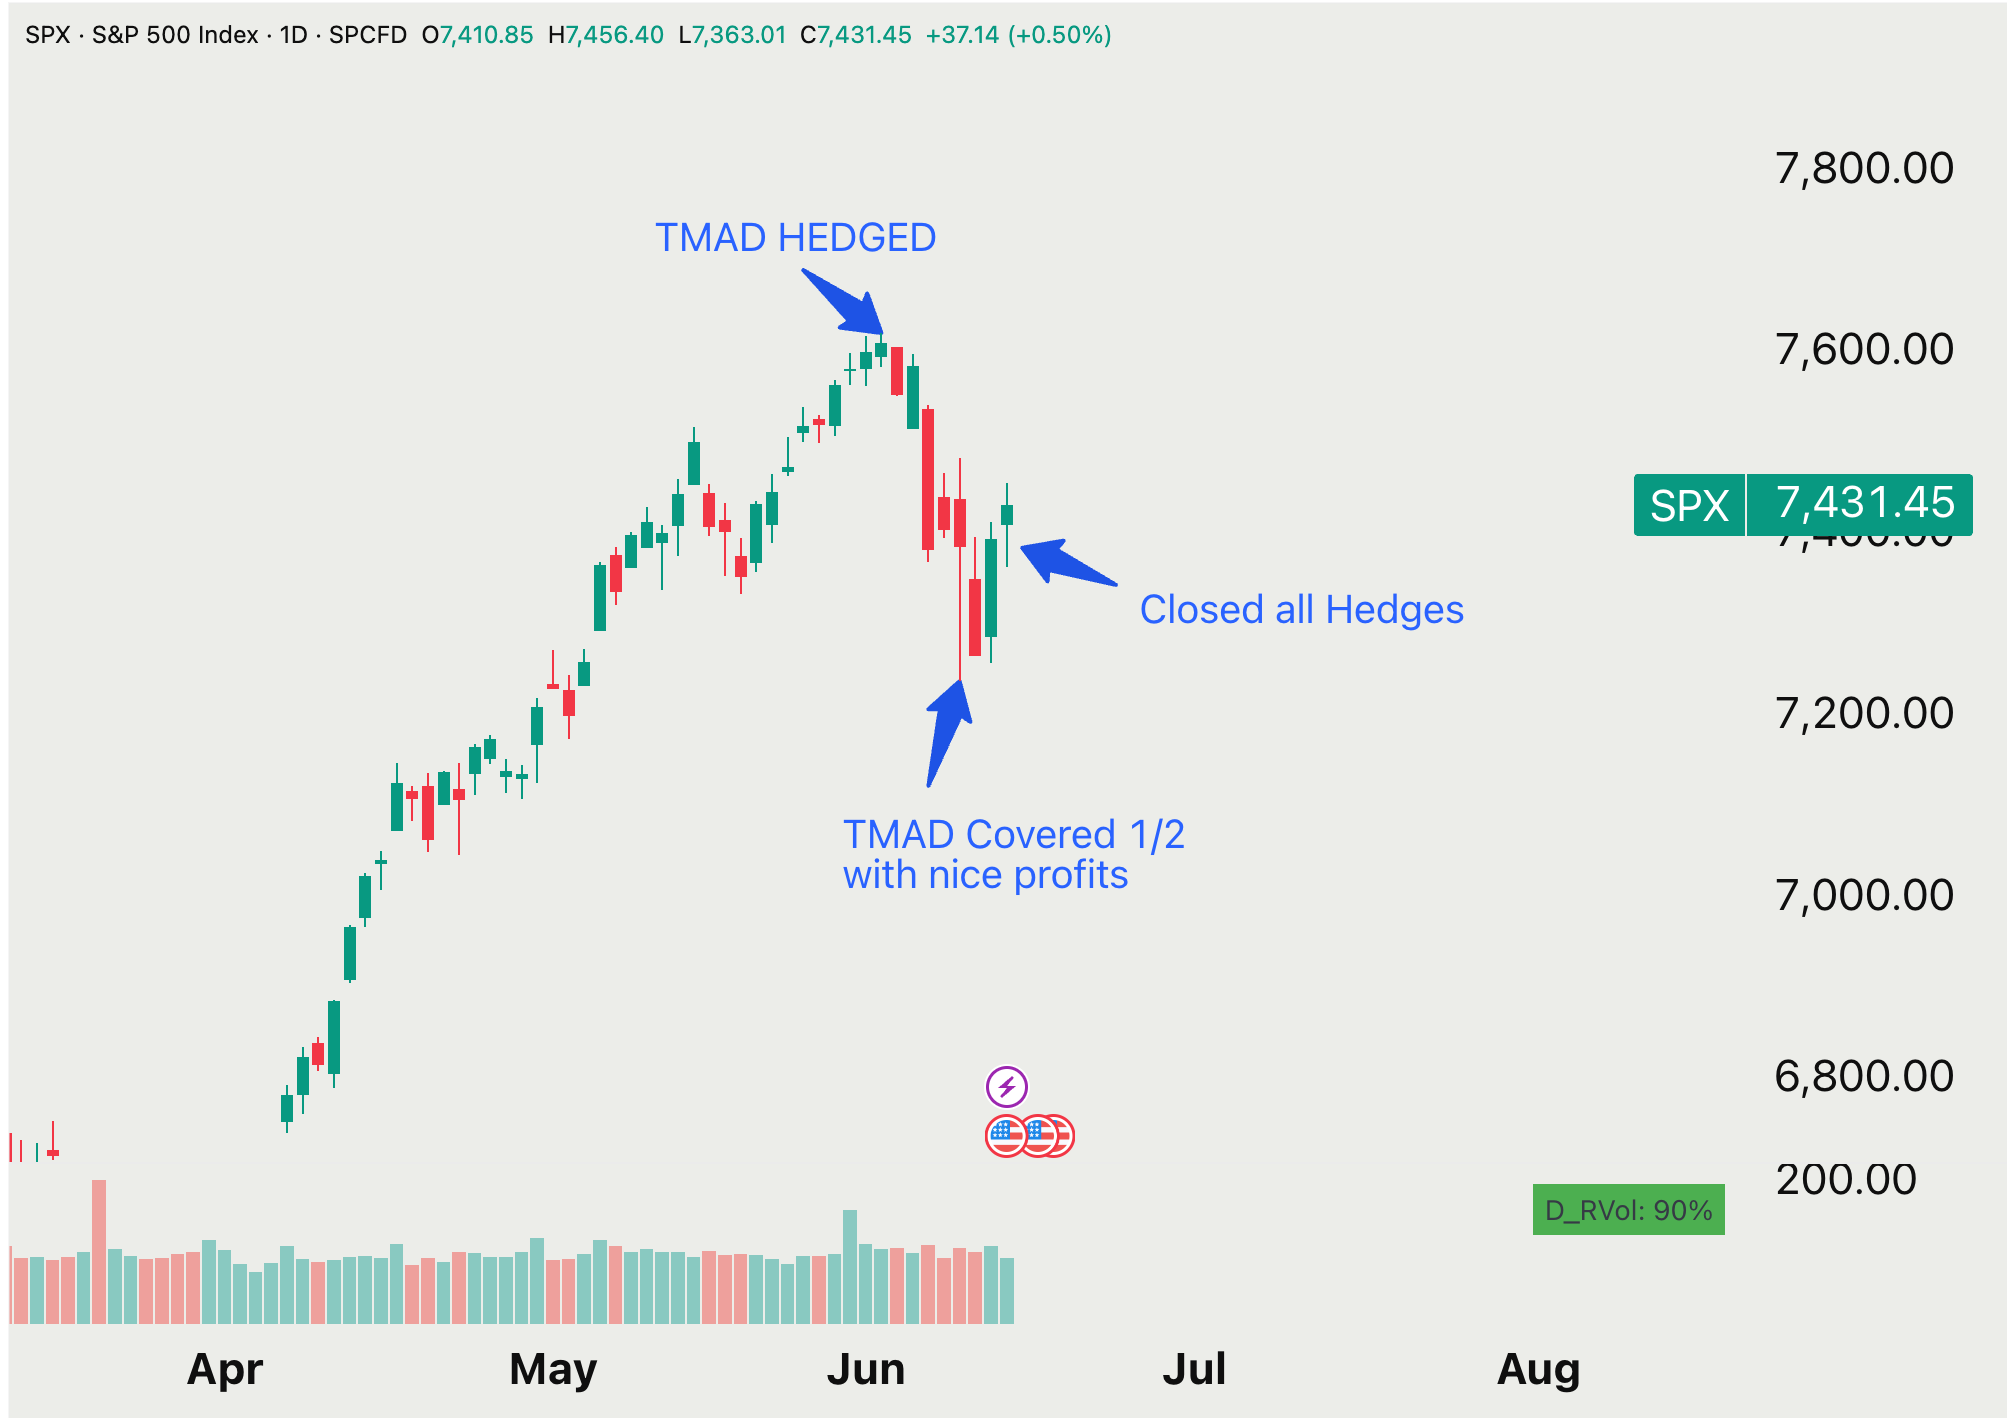
As we said many times in our previous letters, we expected a much-needed pullback in June (2-4%). Further, we don’t expect a stalemate or crash. We believe the market will continue higher, but the summer will be volatile. There is a 10-15% correction potential leading into the Midterm. We will keep you updated about the signs.
We hedged perfectly this month.
Now let’s look at the Top 10 picks for the week and what index has the highest momentum and score.
